
Most property reports give you a line of text: «flood zone», «limited use», «power line nearby». And they ask you to believe it. Hogarfax's interactive viewer does something different: it overlays the official layers on the aerial photo of your plot so you see and check each affection yourself, with no middleman and without trusting a single sentence.
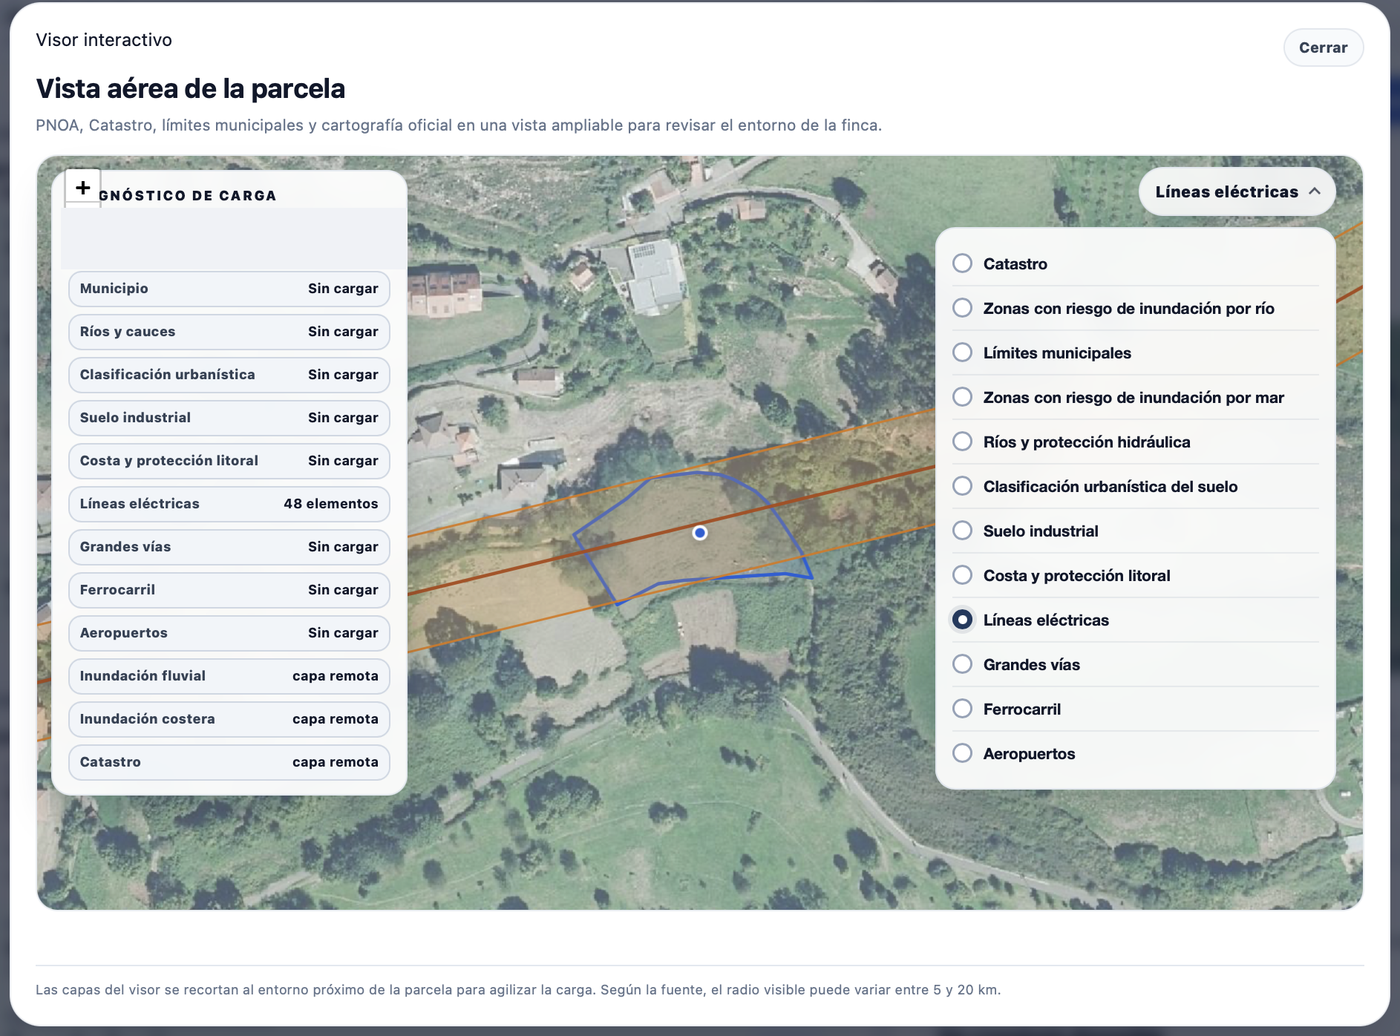
It runs on PNOA (the National Geographic Institute's orthophoto) and the Cadastre parcel map, and on top you can switch official layers on and off one by one. The layers are clipped to the plot's immediate surroundings so they load fast; depending on the source, the visible radius ranges from 5 to 20 km.
Which layers you can overlay
- Cadastre: official parcel map and plot boundaries.
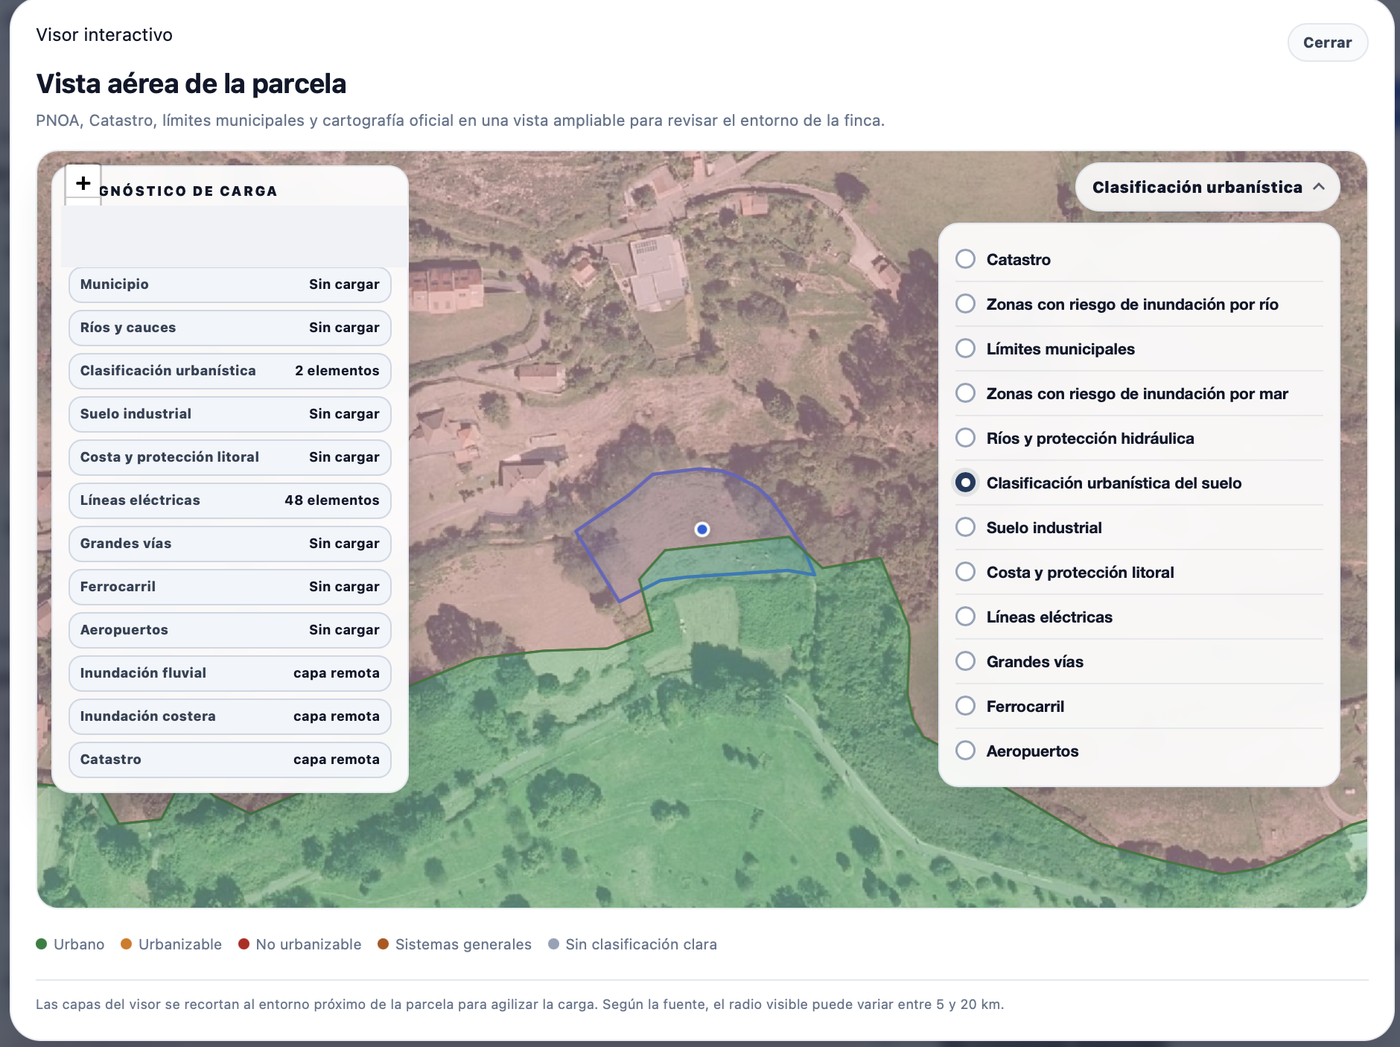
- Urban land classification: urban, developable, non-developable, general systems or no clear classification.
- River flood risk zones and sea flood risk zones: river and coastal hazard mapping.
- Rivers and hydraulic protection and coast and shoreline protection: public domains and easements (DPH/DPMT).
- Power lines: the route of lines near the plot.
- Industrial land: layer of industrial estates and activity in the surroundings.
- Major roads, railways and airports: nearby transport infrastructure.
- Municipal boundaries: to place the plot within its municipality.
Why seeing beats reading (and easily beats asking an AI)
A text saying «limited use» does not tell you how much or where. The viewer does: you see what percentage of your plot falls in each land class and exactly where a power line or a flood-zone boundary runs. It is the difference between a label and a proof.
A real case where the viewer changed everything
On a plot in Oviedo that looked like perfect urban land, the viewer revealed that ~75% of the plot was not buildable urban land and that a power line crossed it down the middle. We tell the full story in the real Oviedo plot case. And if you want the full map of which risks exist, see the complete guide to physical risks.
Open the viewer for your plot
Enter the address or cadastral reference, generate the report and explore the official layers on the plot's aerial photo.
Analyse the propertyFuentes
www.mivau.gob.es/urbanismo-y-suelo/sistema-de-informacion-urbana
Was this article useful?
Your answer helps us improve the blog and understand which guides deserve more depth.